Create Looker Studio Reports Directly from Your Google Sheets
16th May 2024
3 Minutes Read
By Abhishek Tiwari

Do you use Google Sheets to organize your data but want to create stunning visualizations and reports? Looker Studio offers a seamless way to transform your spreadsheets into interactive reports. This blog post will guide you through the process of creating Looker Studio reports directly from your Google Sheets.
Steps to Create a Looker Studio Report from Google Sheets:
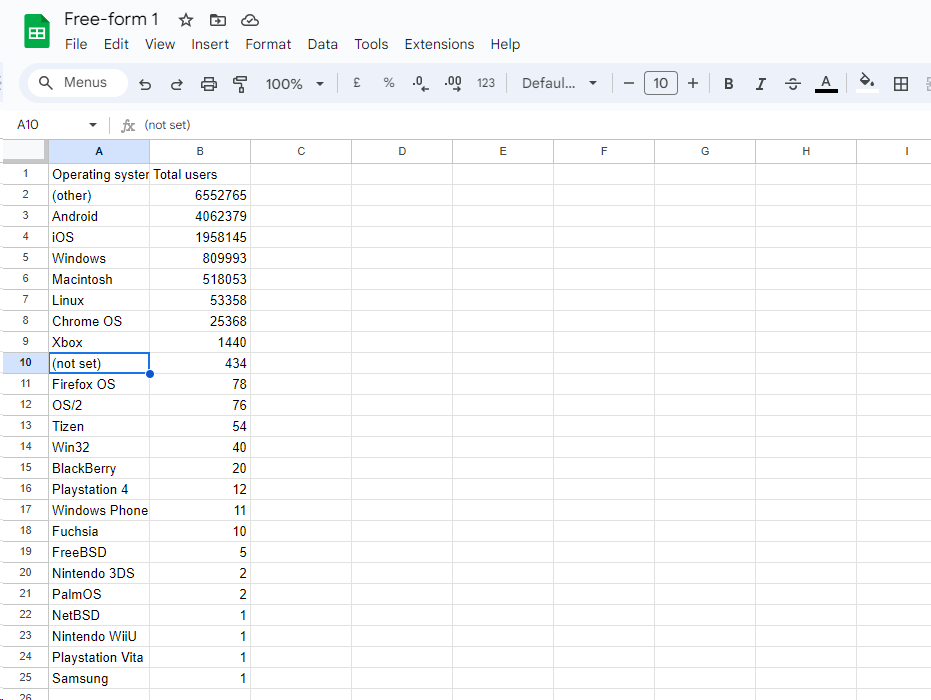
- Navigate to your desired Google Sheet: Open the Google Sheet you want to use for your report.
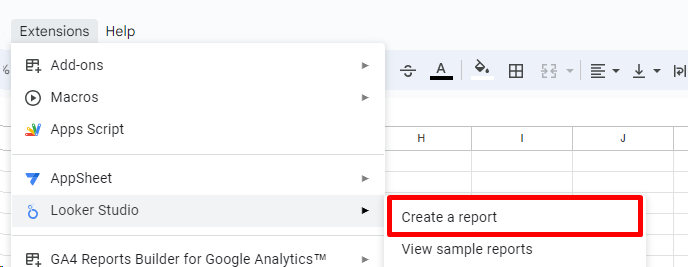
- Access the Looker Studio extension: In the Google Sheets toolbar, click "Extensions" and then select "Create a report" under the "Looker Studio" section.
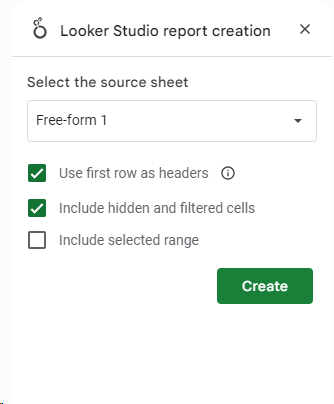
- Configure options (optional): You can choose to use the first row as headers and include hidden/filtered cells or a specific range of data.
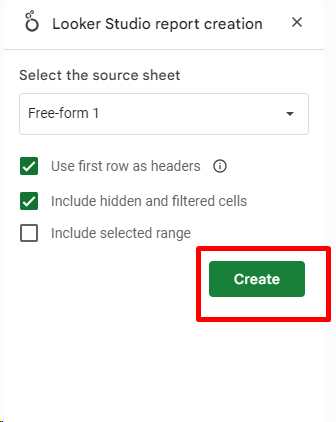
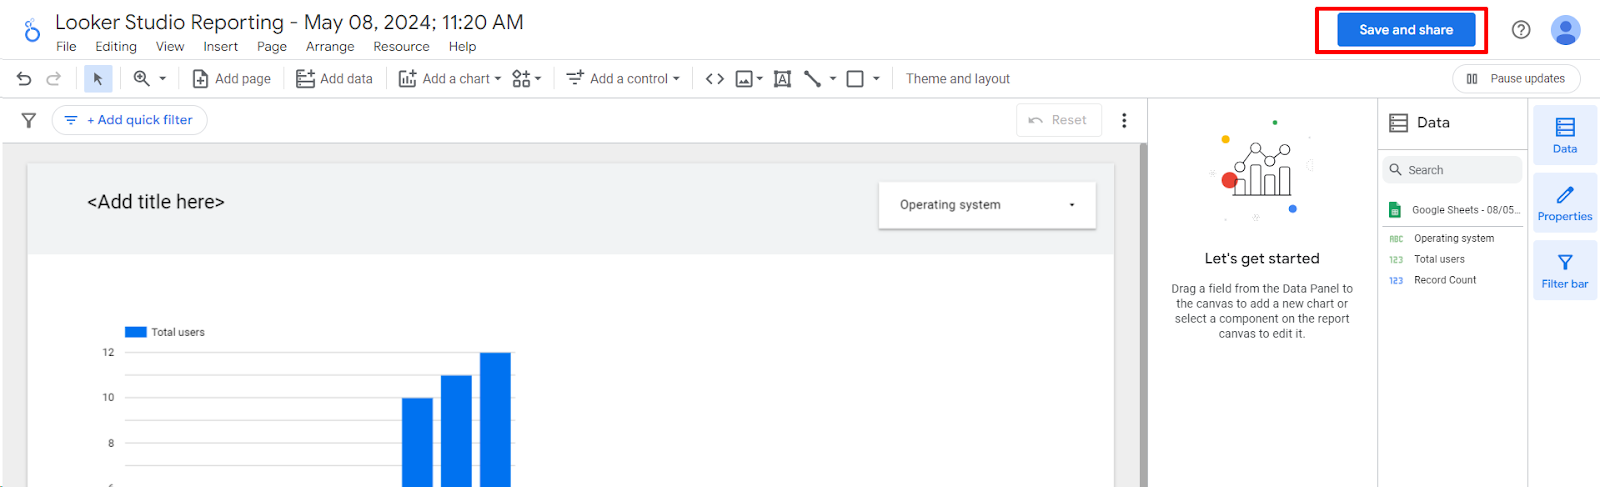
- Create the report: Click "Create" to launch Looker Studio and generate your report based on the chosen Google Sheet
.
- Save and share: Remember to save your report to avoid losing it after 24 hours. You can also edit and share the report with others.
Important Considerations:
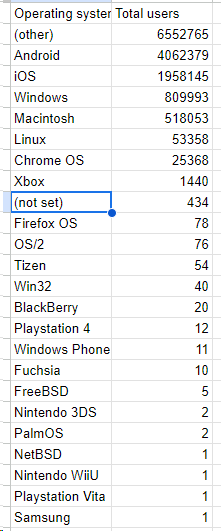
- Data format: Ensure your data is in a tabular format for Looker Studio to work its magic.
- Merged cells: Unmerge any merged cells before creating the report.
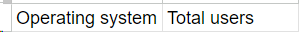
- Header row: Your data should have a single header row.
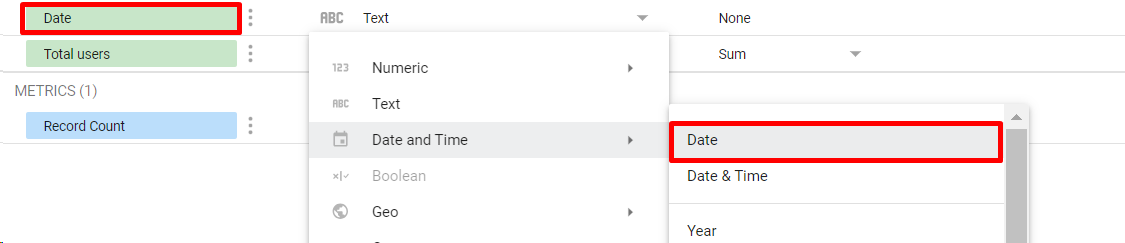
- Data type consistency: Maintain the same data type within each column (e.g., all dates should be formatted as the "Date" type).
Additional Tips:
- Looker Studio automatically names your report based on the creation timestamp. You can customize the name later.

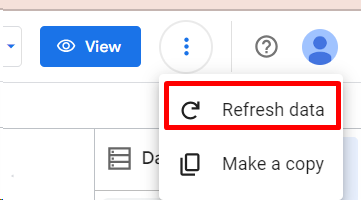
- Refresh your report data manually if changes are made in the Google Sheet.
- Refresh data source fields if you add or edit columns in the Sheet.