
GA4 user journey analysis: page, event, and attribution paths
29th Oct 2026
13 min read
By Harshit Mistry
A B2B website journey is rarely a straight line. A visitor may arrive through a paid campaign, return later through direct traffic, explore a service page through organic search, interact with a call to action, and eventually submit a form. Another visitor may follow a similar path but leave before converting.
GA4 records website activity as events, page views, and traffic-source information. BigQuery makes it possible to bring these signals together so teams can understand both what visitors did on the website and how different acquisition touchpoints appeared across their journey.
This article explains three complementary views of on-site behaviour—page journeys, event-level journeys, and combined journeys—and adds a cross-session source attribution view that connects traffic-source touchpoints to conversion outcomes.
Why User Journey Analysis Matters
Standard analytics reports are useful for measuring individual pages, events, channels, and conversions. However, multi-step B2B journeys can be difficult to understand when each signal is viewed separately.
Two visitors may both reach a form while taking different routes. One may arrive directly and submit immediately. Another may first click a paid ad, return through direct traffic, research services through organic search, and then submit a form. Looking at only the final session or the final source can hide the broader sequence.
Reconstructing behaviour as connected paths helps analysts investigate navigation, interactions, acquisition touchpoints, conversion timing, and drop-off patterns together.
From Individual GA4 Events to a User Journey
A session-level journey table can assemble page and interaction activity into a chronological path, with one row representing one session. Journey steps can be joined using a consistent delimiter such as “→”. This view is useful for understanding what happened within a particular visit.
Three complementary journey representations answer different questions:
1. Page Journey
The Page_Journey_Path contains the ordered sequence of page categories or page labels. It focuses on navigation and excludes clicks, scrolls, and other interaction events.
Example: Homepage → Industry Solution → Services → Contact Page
2. Event-Level Journey
The Event_Journey_Path contains the ordered sequence of interaction events, such as CTA clicks, form views, form starts, content interactions, and media plays. Page visits are excluded.
Example: CTA: Request a Demo → Form View: Lead Form → CTA: Talk to Sales → Article Read → Podcast Play
A page path tells us where a visitor went; an event path tells us what the visitor did. Visitors can reach the same page but behave differently once they arrive.
3. Combined Journey
The Combined_Journey_Path interleaves page views and interaction events in chronological order. It provides the richest session-level representation because it preserves both navigation and behaviour.
Example: Industry Solution → CTA: Request a Demo → Contact Page → Form View: Lead Form → CTA: Talk to Sales → Services → Article Read → Form Submit
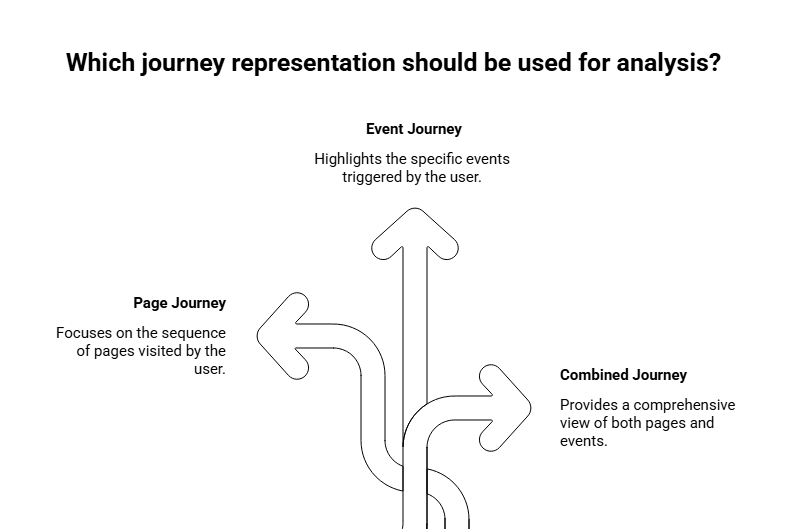
Figure 1. Page, event, and combined journeys provide complementary views of activity within a session.
Why the Event-Level Journey Matters
The event-level journey adds behavioural context that is not visible in a page-only path. It can help teams:
Sequence CTA interactions before and after form activity.
Distinguish a form view from a form start and a successful submission.
Place content interactions, such as article reads or downloads, in the journey.
Identify repeated interactions that may indicate continued research.
Compare the final recorded action with the exit page to understand what happened immediately before a session ended.
This is particularly useful for conversion rate optimisation (CRO). If non-converting sessions repeatedly end after a particular CTA, form interaction, or content action, that behaviour can become a specific point for investigation.
What the Session-Level Table Captures
A session-level table can bring together several logical groups of fields:
Session identification and timing.
Entry page, landing page, exit page, and page context.
Page_Journey_Path, Event_Journey_Path, and Combined_Journey_Path.
CTA clicks, lead CTA clicks, content views, and downloads.
Form starts, form submissions, and conversion status.
Last action, last important page, and post-conversion behaviour.
Device category and geography.
Together, these fields create a session-level record that can be filtered and aggregated for journey dashboards, conversion analysis, and drop-off investigations.
Reading a Journey Path
Example: Direct Conversion
Contact Page → Form View: Lead Form → Form Start → Form Fields → Form Submit ✓ → Homepage
This example shows a visitor reaching a contact page, progressing through a lead form, submitting successfully, and then continuing to another page.
Example: Research-Heavy Journey
Industry Solution → CTA: Request a Demo → Contact Page → Form View: Lead Form → CTA: Talk to Sales → Services → Article Read → Podcast Play
The sequence shows that the visitor did more than navigate between pages: they interacted with lead CTAs, viewed a form, explored services, and consumed content.
Example: Form Exploration and Drop-Off
Homepage → Industry Solution → Service Page → Contact Page → Form View → Form Start → Exit
This path suggests that the visitor showed conversion intent by interacting with a form but did not complete a submission. The next step is to investigate the form experience and the final recorded actions.
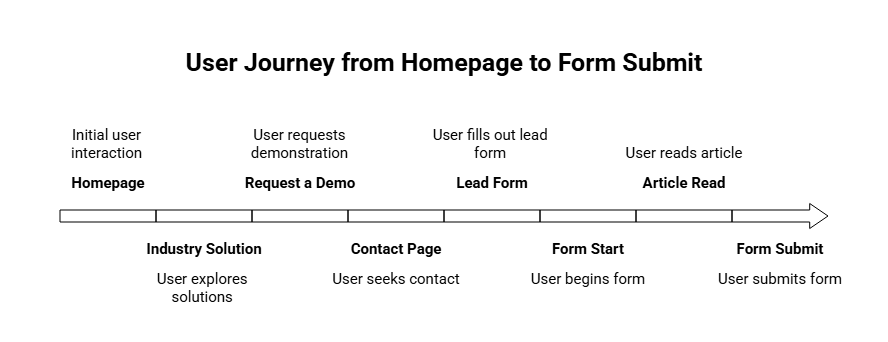
Figure 2. Multiple GA4 events can be assembled into one readable chronological journey path.
Finding Drop-Off Points
Once the journey is reconstructed, drop-off analysis can focus on the sequence immediately before an exit rather than only the page with a high exit rate.
Exit_Page identifies the final page viewed in the session.
Previous_Page identifies the page immediately before the exit page.
Last_Action identifies the final recorded event in the session.
Last_Important_Page identifies the last high-value page before the exit.
Form_Start = Yes with Converted = No can identify sessions where form interaction began without a recorded submission.
Post_Conversion_Journey can show what happened after a successful conversion.
A session that ends after an article read is different from one that ends immediately after a form start. The page and event context helps analysts form more precise CRO hypotheses.
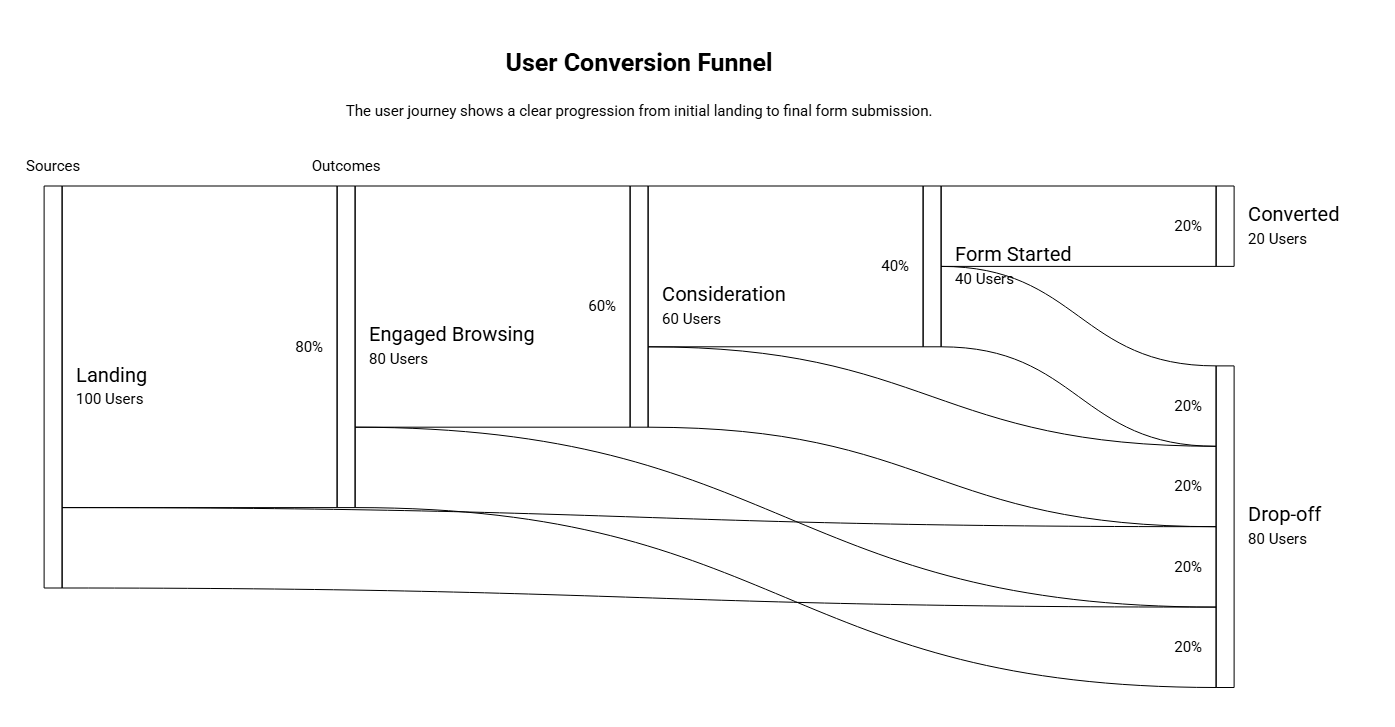
Understanding Funnel Progression Without Scoring
Journey analysis can use observed behaviour to classify funnel progression without assigning a numerical engagement score.
Stage 1 — Landing Only: exactly one page with no qualifying interaction.
Stage 2 — Engaged Browsing: meaningful multi-page or interaction activity without deeper solution exploration.
Stage 3 — Consideration: the visitor reached a service, market, industry solution, or product page.
Stage 4 — Reserved: available for future stage expansion.
Stage 5 — Form Started: the visitor viewed or interacted with a form but did not complete a submission.
Stage 6 — Converted: the visitor successfully submitted a form.
From Session Journeys to Cross-Session Source Attribution
A session-level journey explains what happened during one visit, but a B2B conversion may involve several visits and acquisition touchpoints. A visitor could first arrive through paid search, return through direct traffic, and later come back through organic search before submitting a form.
To understand this broader path, create a separate overall attribution journey table that connects eligible sessions for the same user and orders their source/medium touchpoints chronologically. Unlike the session-level table, this view should not use Session_ID as the boundary for the complete journey. Session_ID can still be retained in the underlying session data for validation and drill-down, but the overall journey should be assembled at the agreed user-identifier level.
Example: One User, Multiple Source Touchpoints
Illustrative source journey: google / cpc → direct / (none) → google / organic
In this example, the user first arrived through paid search, returned through direct traffic, and later arrived through organic search. If the organic-search session contains the form submission, the report can mark google / organic as the source/medium associated with the converting session.
This describes the observed sequence and the conversion touchpoint. It does not, by itself, mean that organic search deserves all conversion credit. Assigning credit across touchpoints requires an explicit attribution model.
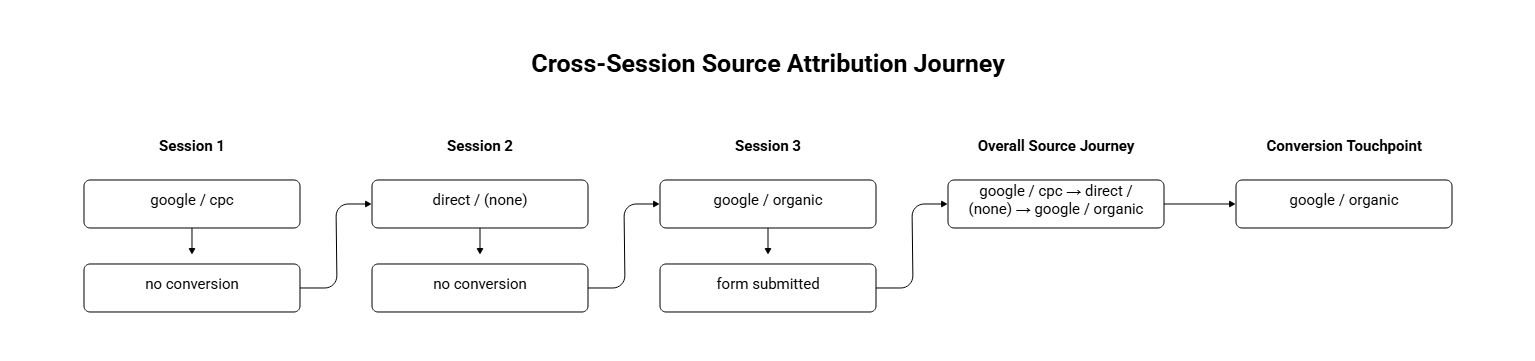
Figure 4. An overall attribution path connects source/medium touchpoints across sessions and identifies the touchpoint associated with the conversion.
Recommended Overall Attribution Table
The overall attribution table should be separate from the session-level journey table because the two tables answer different questions. The session-level table explains on-site behaviour within a visit; the attribution table explains the sequence of acquisition touchpoints across visits.
User identifier: the agreed key used to connect sessions belonging to the same user.
Overall_Source_Journey: chronological source/medium sequence, such as google / cpc → direct / (none) → google / organic.
Conversion_Status: whether a conversion was recorded in the defined journey or reporting window.
Conversion_Touchpoint: the source/medium associated with the session in which conversion occurred.
Conversion_Timestamp: when the conversion was recorded, where available.
Touchpoint_Count: number of eligible source/medium touchpoints included in the path.
Attribution_Model: optional field describing the model used if conversion credit is distributed across touchpoints.
Illustrative table:
User ID | Overall Source Journey | Conversion Status | Conversion Touchpoint |
User A | google / cpc → direct → google / organic | Converted | google / organic |
User B | linkedin / paid → direct | Converted | direct |
User C | google / organic → direct | Not converted | N/A |
These rows are examples only. The conversion touchpoint should be derived from the actual session and conversion records, not inferred from the source sequence alone.
How to Interpret Conversion Attribution
Two concepts should be kept separate:
Conversion touchpoint: the source/medium associated with the session in which the conversion event occurred.
Attribution credit: the share of conversion value assigned to one or more touchpoints under a chosen attribution model.
For example, if a journey contains paid search, direct, and organic search before a form submission, a last-touch view may identify organic search as the converting touchpoint. A multi-touch model may distribute credit across multiple eligible interactions. The report should label which interpretation it uses.
Important Data Considerations
Choose a stable user identifier. A Client_ID or GA4 pseudo-user identifier may connect sessions for the same browser, but it may not reliably join a person across devices, browsers, or cleared cookies.
Define the journey window. Specify how far back the report should look before a conversion and how repeated conversions are handled.
Preserve timestamps. Source/medium touchpoints must be ordered using event or session timestamps, not alphabetically.
Handle direct traffic consistently. Direct visits can appear between campaign touchpoints; document whether and how they are retained in the sequence.
Keep source dimensions consistent. Decide whether the path uses session-scoped source/medium, first-user source/medium, or another defined traffic-source field. Do not mix scopes without clear labels.
Separate observation from credit. The chronological source journey is descriptive; assigning credit requires an explicit attribution rule.
Respect consent and identity limitations. Cross-session stitching depends on available identifiers and applicable analytics consent settings.
From Journey Paths to CRO and Attribution Questions
Combining on-site journeys with source attribution makes it possible to investigate both what visitors did and how they arrived. Useful questions include:
Which source/medium sequences commonly precede a conversion?
Which source/medium is associated with the session in which a form is submitted?
How often does a paid-search visit precede a later direct or organic visit?
Which source journeys have many touchpoints but few conversions?
Which page and event sequences occur within the converting session?
Where do non-converting sessions end, and what was the final recorded action?
How does the observed converting touchpoint differ from the first recorded touchpoint?
How do results change when a different attribution model is applied?
These questions move analysis beyond isolated channel totals. Teams can examine the complete path, identify repeated patterns, and develop more specific CRO or acquisition hypotheses.
GA4 to BigQuery
The session-level workflow starts with GA4 event data exported to BigQuery, where SQL assembles events into one row per session. The additional attribution workflow then uses session-level source/medium and conversion information to build a separate user-level sequence across sessions.
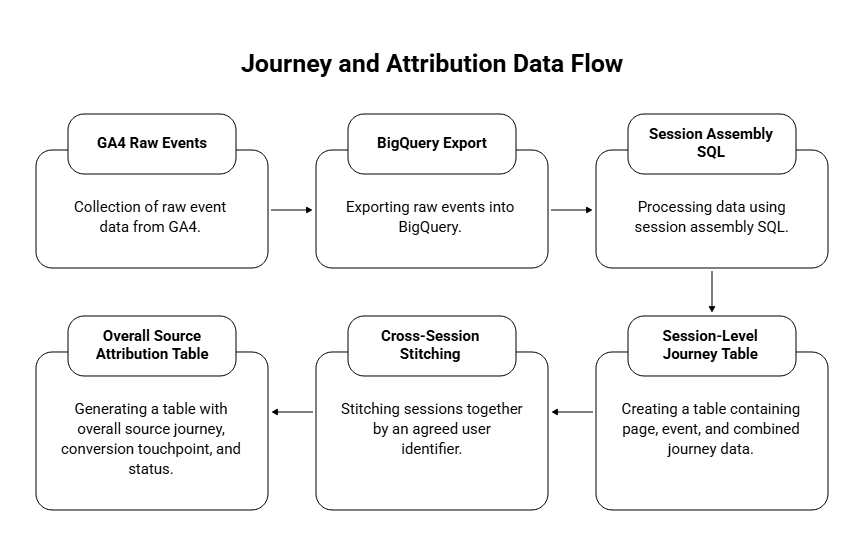
Figure 5. The session-level journey table supports on-site analysis; a separate attribution table connects source/medium touchpoints across sessions.
The overall source journey should be built from the session-level records or the underlying GA4 export using a consistent user key, chronological ordering, a defined lookback window, and explicit conversion logic. Session_ID remains useful for validating individual visits even when the final attribution output is one row per user journey.
What the Combined Dashboard Can Show
Top page journeys, event journeys, and combined journeys.
Conversion versus non-conversion journeys.
Funnel-stage distribution and form-start versus form-submit behaviour.
Top entry pages, exit pages, and last recorded actions.
Overall source/medium journeys across sessions.
Most common source sequences before conversion.
Converting-session source/medium and conversion touchpoint.
First recorded touchpoint versus converting touchpoint.
Conversion outcomes by source journey and touchpoint count.
Post-conversion browsing where the data supports it.
The session-level table preserves behavioural detail, while the overall attribution table summarises the cross-session acquisition path. A dashboard can connect these views without forcing both use cases into a single table grain.
Conclusion
A B2B user journey is more than the list of pages a visitor viewed during one session. It includes the sequence of navigation and interactions that connects entry to outcome—and, for many B2B journeys, the acquisition touchpoints that brought the visitor back over time.
GA4 and BigQuery can support two complementary levels of analysis: a session-level journey that explains what happened during a visit, and a cross-session source attribution journey that shows the chronological source/medium touchpoints associated with a user’s path.
Keeping these views separate but connected makes the analysis clearer. Teams can see what visitors did, which sources appeared along the way, which touchpoint was associated with the converting session, and where non-converting journeys stopped. With a clearly defined user identifier, journey window, and attribution rule, these insights can support more informed CRO, channel analysis, and reporting decisions.
Similar Posts

