Adjust Datascape Reporting: Dashboards, Canvas & KPI Guide
9th Oct 2026
13 min read
By Yashvi Engineer
Adjust Reports Guide: Mobile App Reporting, Event Tracking and KPIs
Table of Contents
Key Sidebar Tools in Adjust Datascape
Start with the Datascape Dashboards
Use Data Canvas to Track Core App Performance Metrics
Leverage Mobile App Retention and Cohort Analysis
Analyze User Activity with Mobile App Usage Analytics
Organize and Isolate Data with Advanced Filters
Essential Mobile App Reporting Metrics Summary
Conclusion
FAQs
Quick Answer
Adjust Datascape splits mobile app reporting into two tools. Dashboards give you an instant, pre-built view of sales, DAUs, and ad spend for daily monitoring. Reports (Canvas) let you build custom breakdowns by dimension and metric when you need to dig into a specific campaign, cohort, or attribution question. Most teams check dashboards daily and build custom reports weekly.
Key Takeaways
Dashboards are for quick daily checks; the Reports Canvas is for custom, dimension-by-metric analysis.
Adjust Datascape organizes daily monitoring into six dashboards: Overview, User Acquisition, Retention, Monetization, SKAN, and Protection.
Building a custom report means choosing dimensions (Campaign, Creative, Ad Network, Country) and metrics (CPI, ROAS, revenue, in-app events).
App cohort analysis groups users by install date so new-download spikes don't mask real retention decay.
Attribution reporting shows the final touchpoint credited with a conversion; Assists reporting surfaces earlier channels that contributed but weren't credited.
Global and module-level filters let you isolate a single country, platform, or campaign without wading through unrelated data.
Introduction
Growing any mobile app, whether it’s an eCommerce platform, fintech app, social media platform, digital publication, gaming app, or another type of mobile product, requires more than simply running ad campaigns. It requires understanding user behavior, measuring engagement, and using mobile app analytics to optimize the user journey and drive growth. It demands a clear understanding of how every campaign impacts installs, engagement, conversions, and revenue. Without unified tracking, marketers struggle to identify which channels deliver high-value users and which campaigns burn ad budgets.
Mastering your mobile app reporting gives your team full visibility across user acquisition and growth loops. From mobile app attribution and user acquisition to retention analytics, revenue tracking, and campaign performance measurement, Adjust Datascape helps businesses map out the complete product journey. Whether analyzing lead submission paths or content consumption, centralizing your core mobile app analytics metrics into a single view eliminates the need to juggle fragmented ad network dashboards.
This guide breaks down the essential reporting capabilities in Adjust Datascape, including Reports and Dashboards, to help you understand when to use each. Use Reports when you need detailed, customizable data analysis to evaluate campaign performance, conversion paths, and key metrics. Use Dashboards when you need a quick, visual overview of important performance metrics for ongoing monitoring and decision-making. Together, these capabilities help you refine campaigns, optimize conversion paths, and scale your mobile app with confidence.
Key Sidebar Tools in Adjust Datascape

Navigating a comprehensive measurement platform can feel complex, but Adjust Datascape simplifies workflow by organizing features into four core sidebar tools:
Dashboards: Your daily starting point. Dashboards deliver an instant snapshot of high-level performance, including sales, app orders, average order value (AOV), daily active users (DAUs), and ad spend across all paid channels.
Reports: A customizable canvas designed to slice and dice performance by specific flash sales, product categories, geographic regions, or promotional discount codes.
Campaign Lab: The link-management hub for user acquisition. Campaign Lab lets you build customized deep links and dynamic links for influencer promo codes, cart-abandonment SMS triggers, or scannable packaging QR codes.
AppView: The bridge connecting user behavior to your reporting engine. AppView maps custom in-app actions such as add_to_cart, quote_submitted, casestudy_downloaded, or checkout_complete directly to your analytics platform.
There are lists of mobile app marketing tools that help app marketers make decisions about their mobile app performance, such as Firebase, Amplitude, and AppsFlyer. If you are looking for the best analytics tools, this detailed comparison guide will help you choose the tool for your business.
1. Start with the Datascape Dashboards
Dashboards give you an instant check-up on your store or app's overall health. Instead of spending hours pulling raw data into manual spreadsheets, you can open pre-built views to see real-time performance.
Adjust Datascape organizes these insights into dedicated dashboards:
Overview Dashboard: Your daily command center. Use this every morning for a quick snapshot of total app orders, ad spend, average DAUs, and net revenue across all ad networks.
User Acquisition Dashboard: Shows which ad networks bring in real shoppers. It reveals whether your Meta catalog ads, Google Shopping campaigns, or TikTok video ads drive high-intent traffic that downloads your app.
Retention Dashboard: Keeps tabs on user loyalty and repeat buyers. If users download your app during a seasonal promo but uninstall it 3 days later, this dashboard highlights that drop-off point so you can fix your post-purchase setup. Improving your baseline mobile app retention ensures you aren't filling a leaky bucket.
Monetization Dashboard: Tracks total revenue, average order value (AOV), and purchase frequency to verify whether customer spend is actually growing.
SKAN Dashboard: Monitors iOS shoppers while adhering strictly to Apple's privacy frameworks, showing how your iOS campaigns convert without breaking privacy rules.
Protection Dashboard: Helps monitor rejected or unverified traffic associated with potential ad fraud, giving you visibility into suspicious activity and its impact on your campaigns rather than directly blocking fraudulent traffic.
Tip 💡: Build a daily 3-step routine: start on Overview for a rapid sales check, hop to User Acquisition to scale winning channels, and finish on Retention to protect long-term customer loyalty.

Figure 1.1 Dashboards provide instant performance insights.
2. Use Data Canvas to Track Core App Performance Metrics
Standard dashboards offer a high-level picture, but optimizing growth requires deeper answers. When you need to know which specific product line, discount code, or video creative drove your highest-margin sales, use the Reports Canvas to build custom tabular reports.
To start, navigate to Reports → New Report in the left navigation menu.
Step 1: Select Your Dimensions (Data Groupings)
Dimensions group your data into clear categories. Common eCommerce and mobile dimensions include:
Campaign Name: Compare specific sales events (e.g., Summer Flash Sale vs. Fall Clearance).
Creative: Evaluate whether product carousel ads convert better than short video ads.
Ad Network / Channel: Compare channels like Google Shopping, Instagram, and TikTok side-by-side. (When setting up ad destinations, implement deep links and dynamic links to route users straight to targeted in-app content.)
Country / Region: Track regional shipping promos (e.g., US Free Shipping vs. UK Promo).
Step 2: Choose Your Metrics (Data Measurements)
Metrics represent the performance numbers inside those dimensional categories. Important app performance metrics and mobile app conversion metrics to measure include:
Cost Per Install (CPI)
Return on Ad Spend (ROAS)
Total Revenue & Average Order Value (AOV)
In-app actions (e.g., add_to_cart and purchase events)
Tip 💡: Group your canvas data by Campaign Name while adding ROAS and purchase events. This immediately reveals whether your retargeting campaigns drive profitable orders or merely accumulate expensive clicks without sales.

Figure 2.1 Customize reports with specific metrics.
3. Leverage Mobile App Retention and Cohort Analysis
Surface-level numbers like total clicks or raw downloads don't tell the full story. To scale sustainably, you need to understand how user behavior unfolds over time and trace the touchpoints that contribute to conversion.
App Cohort Analysis: Tracking Long-Term User Loyalty
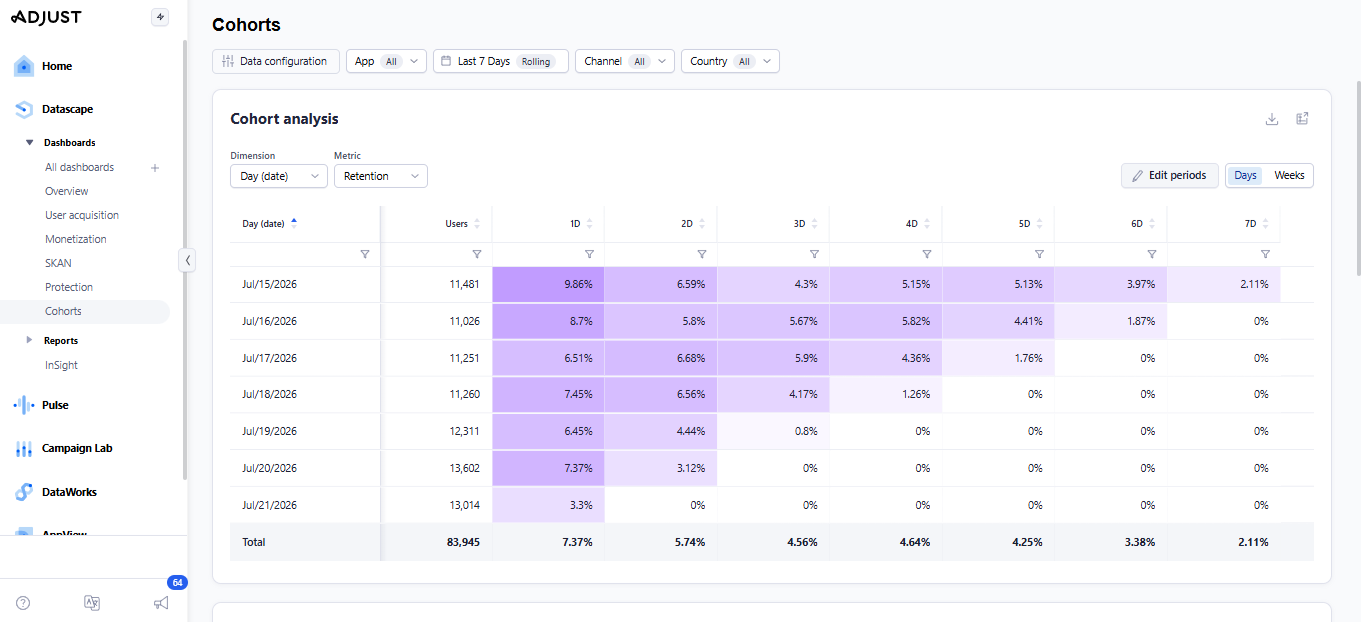
Instead of looking at all users at once, app cohort analysis groups users by the day or week they installed your app. For example, suppose 5,000 new shoppers install your app during a 24-hour Flash Sale on Monday. A cohort table can show how many of those users return on Day 7, Day 14, or Day 30 to place a second order.
Comparing retention rates across different cohorts helps you identify whether user engagement is improving or declining over time. If retention drops sharply after Day 3, it may indicate an opportunity to improve post-install onboarding or introduce re-engagement strategies such as push notifications or email campaigns.
Figure 3.1 Track user retention over time
Mobile App Attribution & Assists Reporting
A user's conversion journey is rarely limited to a single interaction. For example, a shopper might follow this path:
A buyer views an Instagram product ad while scrolling in the morning.
They search for your brand on Google later that night.
They click a Google search ad and complete an in-app purchase.
Depending on the attribution model and reporting configuration, the final conversion may be attributed primarily to the last eligible touchpoint. In this example, Google could receive the conversion credit under a last-touch attribution approach, while the earlier Instagram interaction may receive no direct conversion credit.
Assists reporting can provide additional context by surfacing eligible touchpoints that contributed to a conversion journey without receiving the primary conversion credit. Depending on the configuration and available attribution data, these may include interactions from channels such as social media, paid search, display, or other tracked advertising sources.
Tip 💡: Use Assists reporting to identify your top "wingman" channels (like TikTok or Instagram) that drive initial product discovery, ensuring you don't accidentally cut ad spend that feeds your overall sales funnel.

Figure 3.2 Identify channels driving assisted conversions.
4. Analyze User Activity with Mobile App Usage Analytics
Understanding user interaction inside your app is essential for increasing lifetime value. Monitoring mobile app usage analytics gives product managers and marketers a clear view of how often users log in, how long their sessions last, and which features hold their attention.
Tracking Essential Mobile App Engagement Metrics
To optimize your user experience, focus on key mobile app engagement metrics and app user engagement metrics:
Daily Active Users (DAU) & Monthly Active Users (MAU): Measure your active audience size and overall user stickiness.
Session Duration & Frequency: Indicates how deeply users interact with your content or catalog during each visit.
Mobile App Event Tracking: Enables you to track critical user interactions such as viewing product pages, saving items to a wishlist, or completing a tutorial, providing the granular interaction data needed to eliminate funnel friction.
By tracking core mobile app KPIs related to engagement alongside revenue metrics, you can quickly spot drop-offs in your onboarding sequence, optimize feature adoption, and boost overall conversion rates.
5. Organize and Isolate Data with Advanced Filters
When managing multiple campaigns across diverse channels, reporting data can quickly become noisy. Filters act like a pair of high-definition glasses, helping you isolate the exact numbers that impact your profit margins.
Adjust Datascape provides two flexible levels of filtering:
Global Filters (Top Bar): Control your macro view across all dashboards. You can segment by App & Platform (comparing iOS vs. Android user value) or Country to measure specific regional shipping promos or localized offers.
Module Filters (Middle Bar): Allow granular drill-downs within individual reports. Filter by Touchpoint Type (clicks vs. impressions) or Assisting Networks to analyze how partners like Meta or TikTok work alongside Google Search campaigns.
Tip 💡: When auditing a regional flash sale in France, set your top-bar filter to Country: France and Platform: iOS. The global clutter instantly disappears, showing only the sales, ad spend, and orders for that specific campaign.

Figure 4.1 Apply filters to refine data
Essential Mobile App Reporting Metrics Summary
To keep your growth strategy on track, regularly audit these core mobile app reporting metrics across your team's operational reviews. For user acquisition, measure Cost Per Install (CPI) and ROAS to gauge the efficiency and profitability of your paid ad channels. For retention and churn, evaluate app cohort analysis and your mobile app churn rate to track user loyalty over time against uninstall rates. For engagement, monitor mobile app event tracking alongside DAUs and MAUs to understand feature interaction, stickiness, and usage intensity. Finally, for conversion and monetization, track mobile app conversion metrics and Average Order Value (AOV) to measure goal completions like cart additions and overall revenue.
Conclusion
Mastering mobile app reporting in Adjust Datascape isn’t about becoming a full-time data scientist; it’s about knowing where to look to protect your profit margins and guide growth.
Start your day with Dashboards for a quick revenue check, use Canvas to build custom purchase-funnel reports, monitor mobile app retention against benchmarks, and apply filters to cut through data noise. By turning real user behavior into actionable insights, you can make more informed decisions about your mobile app acquisition and growth strategy.
Ready to get more value from your mobile app data? Book an app analytics audit with AnalyticsLiv to identify tracking gaps, data-quality issues, and opportunities to improve your measurement strategy.
FAQs
1. What are the top mobile app KPIs every manager should track?
The top mobile app KPIs fall into four main categories:
Acquisition: Cost Per Install (CPI) and Customer Acquisition Cost (CAC).
Engagement: Daily Active Users (DAU), Monthly Active Users (MAU), and session duration.
Retention: Retention rate by cohort and mobile app churn rate.
Monetization: Return on Ad Spend (ROAS), Average Order Value (AOV), and Lifetime Value (LTV).
2. How does mobile app event tracking help optimize conversion rates?
Mobile app event tracking monitors specific in-app user actions such as add_to_cart, submit_lead, or checkout_complete. Mapping these events in your reporting tool reveals exact drop-off points in your conversion funnel so you can eliminate UX friction.
3. Why should I use app cohort analysis instead of standard retention metrics?
App cohort analysis tracks specific groups of users who downloaded your app during the same timeframe (such as a 24-hour promo). This prevents new download spikes from masking retention decay, letting you measure true long-term user loyalty.
4. What is the difference between direct mobile app attribution and assisted conversions?
Direct mobile app attribution credits the final touchpoint (click or view) immediately preceding an install or order. Assisted reporting credits earlier interactions across other ad networks, like top-of-funnel Instagram or TikTok views, that introduced the user to your app along their journey.
5. Which mobile app analytics tools are best for marketing performance?
Different mobile analytics tools solve different problems. Adjust Datascape and AppsFlyer are built for attribution and campaign measurement. Firebase Analytics is developer-focused and handles event tracking. Amplitude leans toward product analytics and user behavior. Pick based on whether you're measuring acquisition, tracking events, or studying in-app behavior.
Similar Posts