The Summary Report
What your history shows, with the evidence.
- How well the model fits (R², MAPE, wMAPE)
- Each channel’s share of spend vs its share of extra revenue
- ROI by channel, and where returns diminish
Share of revenue, by source
Media & Performance
SEO & AI SEOGoogle Ads & Meta AdsYouTube & DV360Amazon DSPAnalytics & Measurement
Google Analytics 4 & GTMApp & Product AnalyticsWebsite Conversion & A/B Testing (CRO)Conversion Tracking & Server-SideCloud, Data & AI
Google Cloud Partner ServicesData Analytics, BigQuery & Looker StudioAgentic AI & AutomationGoogle Workspace & Business EmailOr call +91 83205 76622
Marketing mix modeling (MMM) is a statistical model that estimates how much revenue each marketing channel drives, using your own spend and revenue history. Our MMM is for teams that spend across Google Ads, DV360, Meta and offline media. For marketing ROI and budget planning, you get each channel’s contribution, its ROI and a better split of the same budget.
Because last-click attribution only credits what it can track. Awareness gets nothing, and whichever channel fires the final pixel takes everything. Weaker tracking makes it worse.
MMM compares total spend with total revenue over months, with no cookies or consent needed. Below, one budget read both ways.
It fits a Bayesian model to your weekly spend and revenue to separate each channel’s effect. Only totals go in.
Media spend from Google Ads, DV360 and Meta, plus TV, print and other media as CSV.
Revenue, or another number you track. Promotions, holidays and other controls.
It separates each channel’s effect from base revenue, with a confidence range on every number. Aggregate totals only.
Summary Report: contribution and ROI by channel, and where returns diminish.
Optimisation Report: a new split of the same budget, and what the move is worth.
Two reports: what happened, and where to move budget.
What your history shows, with the evidence.
The same budget, split better.
Example reports with illustrative figures.
Add spend, your KPI and the ROI you expect (or use defaults). See the 95% confidence range first.
About ten minutes. Browse charts of your data meanwhile.
Both land in your inbox, with the input settings attached.
That is the model’s main output, with base revenue shown separately.
MMM fits a response curve for each channel. Past the bend, each extra rupee earns less. That tells you where the next rupee should go.
Every estimate has a confidence range.
Totals only. No cookies, user data or consent needed.
About ten minutes, so you can test a scenario in the meeting.
Add the ROI you expect per channel, or take the defaults.
A statistical method that estimates how much revenue each marketing channel drives. It compares spend and revenue over time instead of following clicks, and shows each channel’s contribution, ROI and where returns start to fall.
Ideally 12 to 24 months of weekly spend and KPI data. Spend connects from Google Ads, DV360 and Meta; offline media comes as CSV. If your data is scattered, our BigQuery and data engineering team can pull it together first.
Both. Channel level shows what each channel adds and where the next rupee should go. Campaign level goes deeper for accounts with concentrated spend.
It only uses weekly totals of spend and revenue: no cookies, no user data, no consent needed. So it can measure what tracking can’t see, such as TV and awareness.
About ten minutes for a full Bayesian run. Both reports arrive by email when it finishes.
Monthly or quarterly, as new data comes in. What-if scenarios, such as “cut Meta 20%”, can run any time against the current model.
Yes. It runs in your browser at mmm.analyticsliv.com. To see it on your own data with a specialist first, book a demo below.
Book a 30-minute demo on your own spend history. We show each channel’s contribution and a better budget split on the call.
A specialist replies by email to set up the demo on your own spend history.
Prefer to talk? Call +91 83205 76622, message us on WhatsApp or email [email protected].
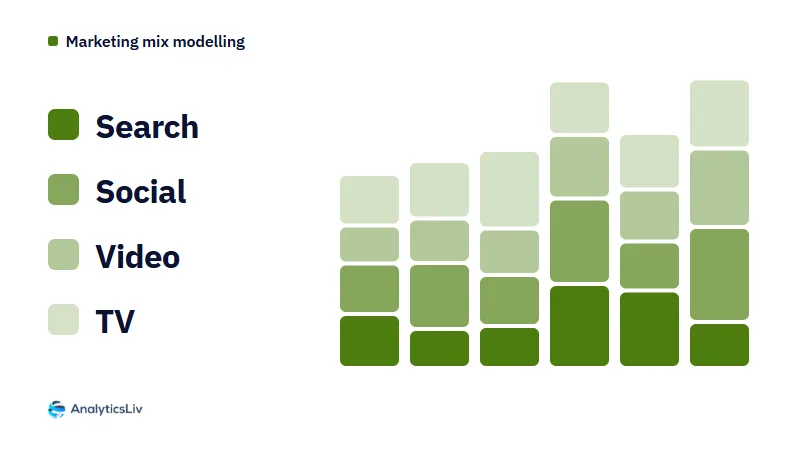
Marketing mix modeling (MMM) is a causal model that uses past data to show how each channel, campaign or promotion drove sales, revenue or leads.
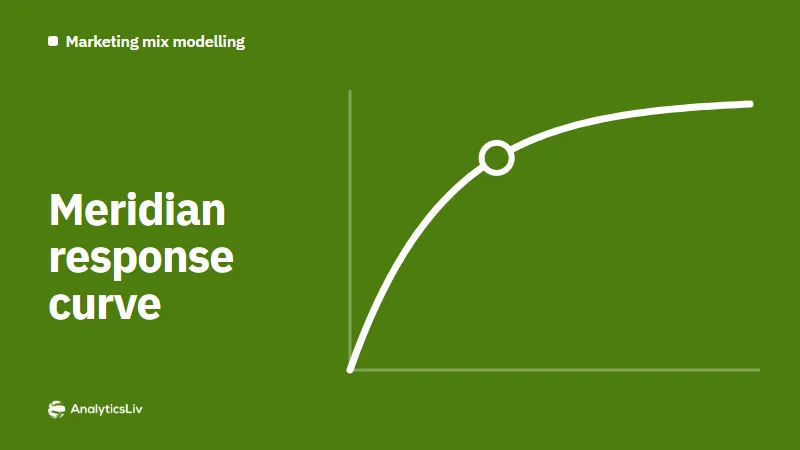
A step-by-step guide to Google's open-source MMM framework: how calibration, Bayesian priors and reach-and-frequency data improve budget decisions.
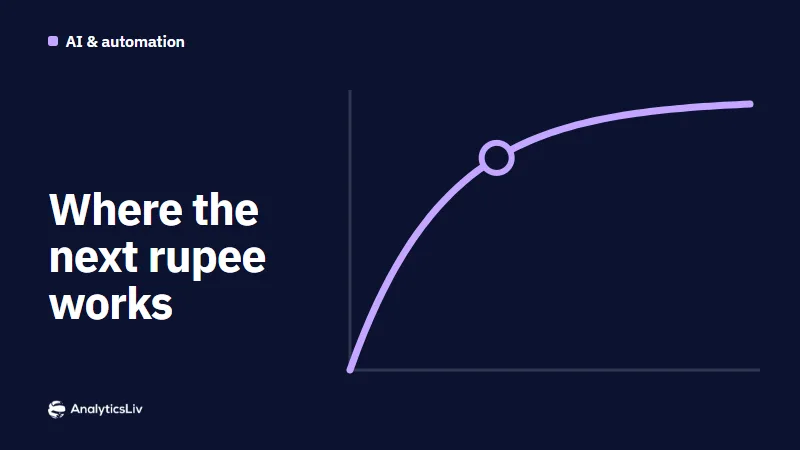
How machine learning models optimize ad spend across platforms, shift budget to rising returns and automate pacing without guesswork.