In short
Seven Looker Studio calculated fields you can paste into a data source: ROUND for decimals, a percentage change formula, CASE WHEN for true/false flags, dates to quarters, DATE_DIFF for days between dates, CONCAT for joining text, and a CASE formula that labels dates as Current Month, Last Month or X months ago, even across a new year.
Contents7 sections
Looker Studio calculated fields turn raw data into numbers and labels people can read at a glance. This guide collects seven formulas from our Looker Studio video series: rounding numbers, percentage change, CASE WHEN true/false flags, dates to quarters, days between dates, joining text values and automatic date labels. Each one has a short video tutorial.
To add any of them, open your data source, click “Add a field” and paste the formula into the calculated field editor.
1. How do you round a number in Looker Studio?
Why is this useful? Rounding numbers to a set number of decimal places makes data easier to read, especially financial data, rates and percentages. It removes precision nobody needs.
Use the ROUND() function:
ROUND(Value, Decimal_Places)- Value: the number you want to round.
- Decimal_Places: the number of decimal places to round to.
Example: to round average purchase revenue to one decimal place:
ROUND(Average purchase revenue, 1)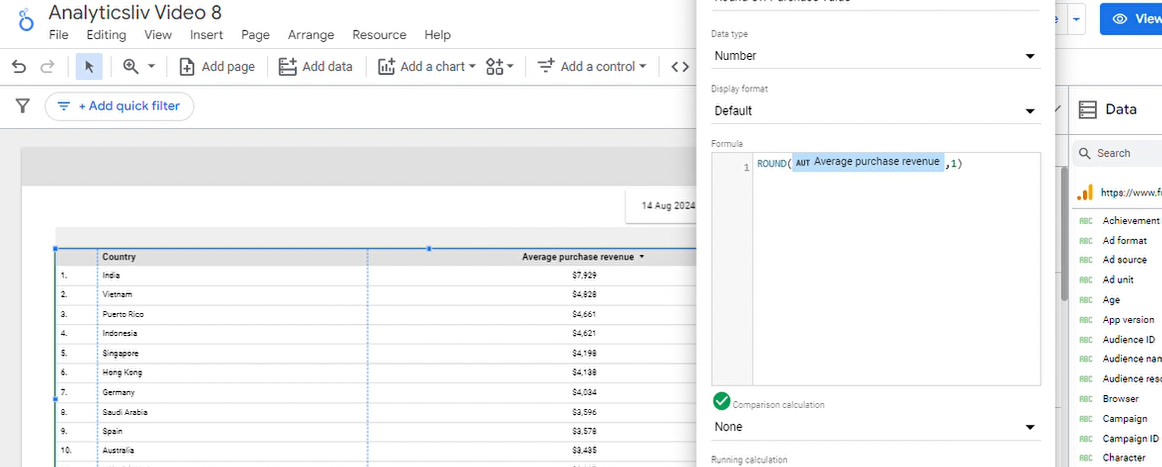
With one decimal place, 123.456 is shown as 123.5. With 2, it is shown as 123.46.
Benefits:
- Cleaner reports with consistent number formats.
- Data that non-technical stakeholders can follow.
Video: Rounding numbers to decimal places
2. How do you calculate percentage change in Looker Studio?
Why is this useful? Percentage change shows trends, growth or decline over time. It is common in performance analysis for KPIs, revenue and traffic.
((Current_Value - Previous_Value) / Previous_Value) * 100Example: comparing Total users with New users:
((Total users - New users) / New users) * 100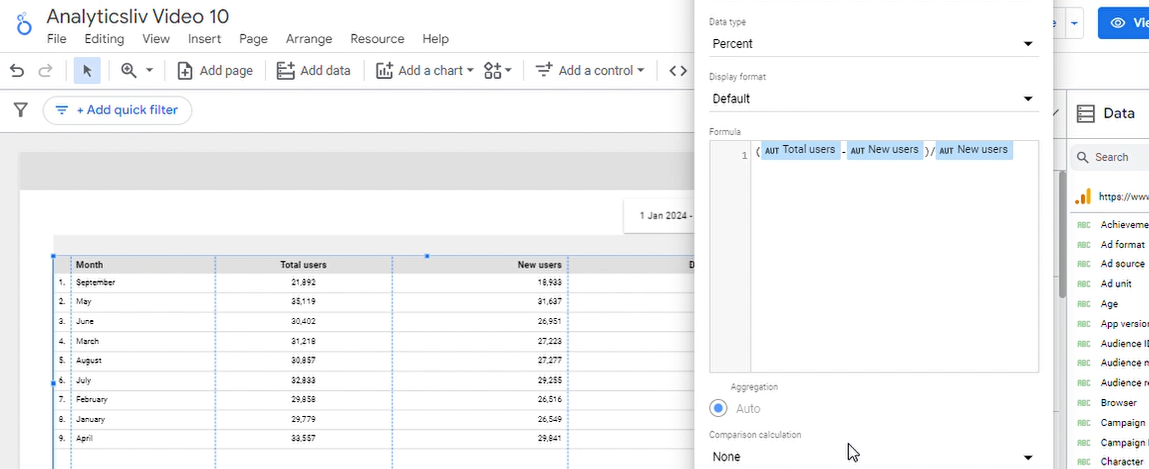
Benefits:
- Shows performance trends clearly.
- Highlights areas that need attention.
Video: Calculating percentage change
3. How do you return true or false with CASE WHEN?
Why is this useful? Boolean values (true/false) make it simple to categorise and filter data, set thresholds, segment data or flag anomalies.
CASE
  WHEN Condition THEN TRUE
  ELSE FALSE
END
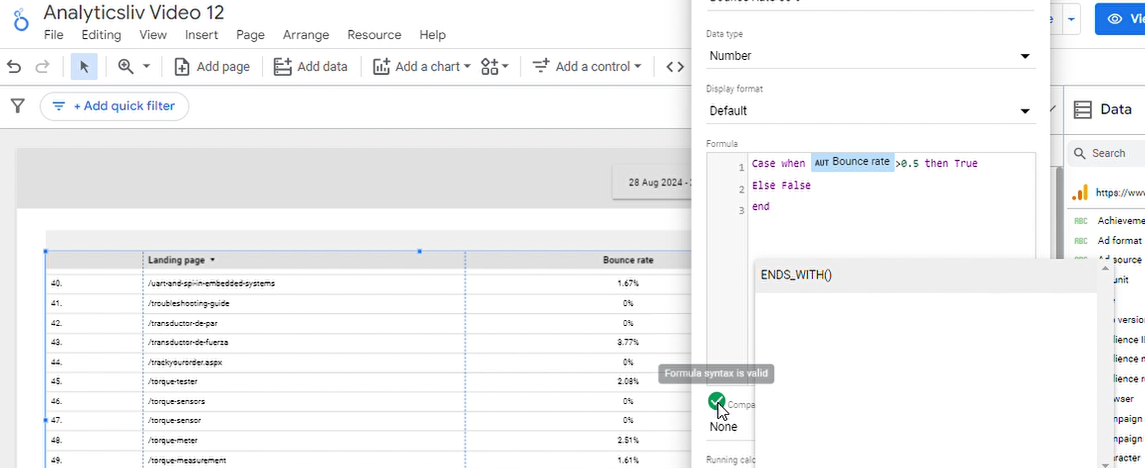
Example: flag rows with a bounce rate above 50%:
CASE
  WHEN Bounce_Rate > 50 THEN TRUE
  ELSE FALSE
END
This returns true where the bounce rate is above 50% and false otherwise.
Benefits:
- Simpler categorisation and segmentation.
- Easy filtering and focused analysis.
Video: Creating boolean values with CASE WHEN
4. How do you convert dates to quarters in Looker Studio?
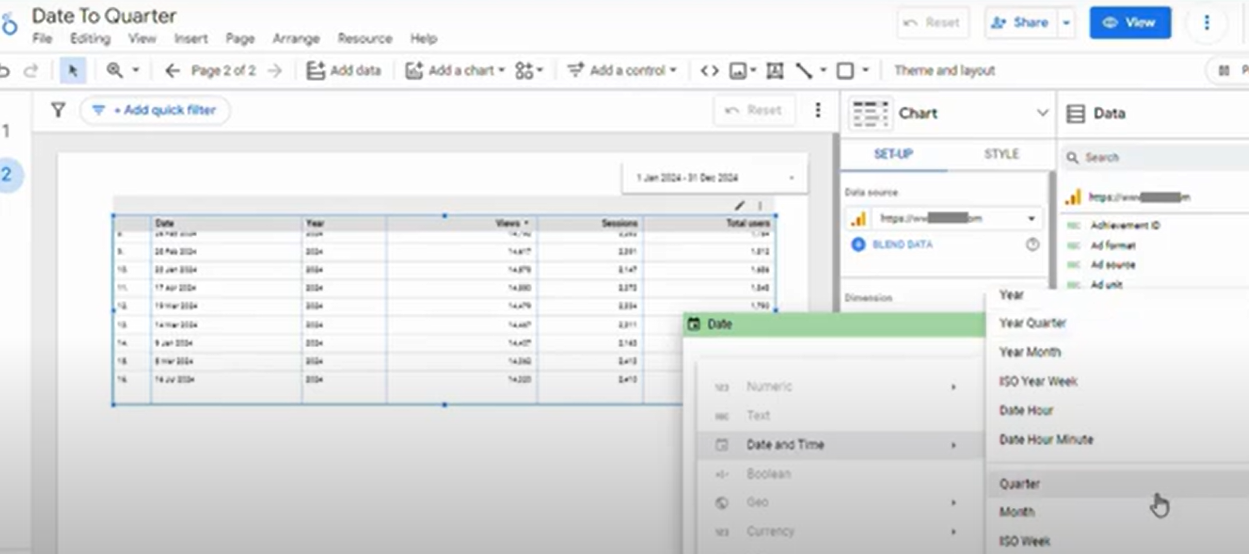
Changing the data type of a date field to a quarter format groups dates by quarter. This is useful for quarterly reporting, for example when you aggregate data over fiscal quarters to see trends. Looker Studio also has a QUARTER(Date) function that returns the quarter of a date.
Video: Date to quarter in Looker Studio
5. How do you count the days between two dates?
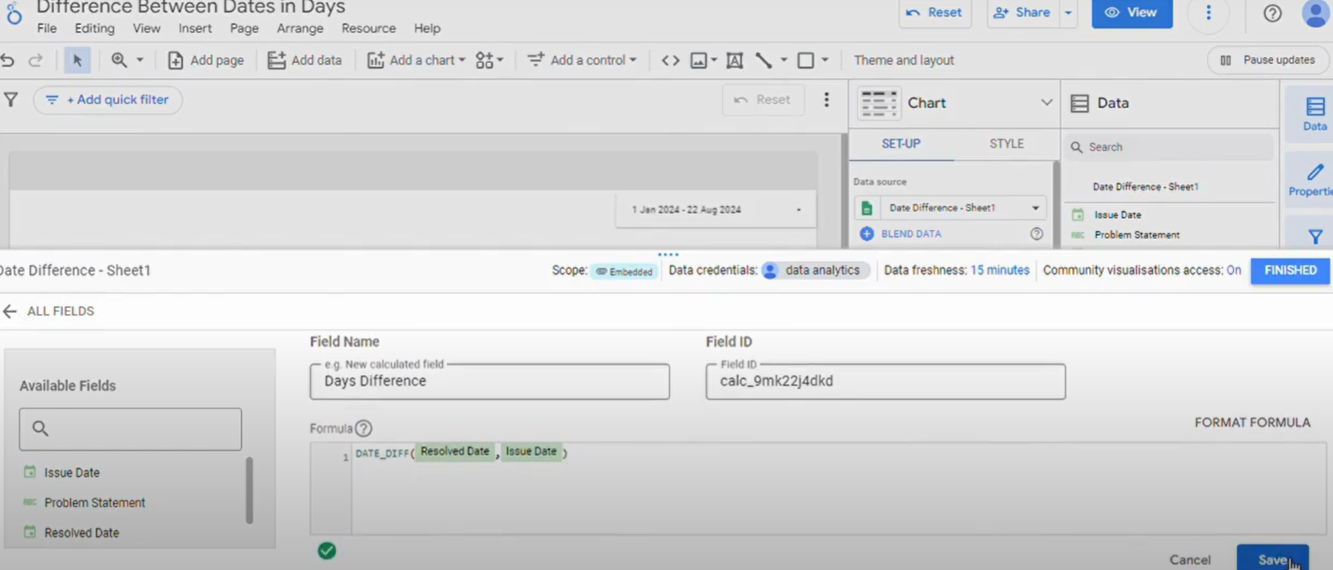
The DATE_DIFF function returns the number of days between two dates. It is useful for time spans such as campaign durations or project timelines.
DATE_DIFF(End date, Start date)Looker Studio’s date format options then let you control how dates are displayed, so they read the same way across the report.
Video: Calculate days between dates and format date display
6. How do you join text values with CONCAT?
When you need to combine values into a single string, use CONCAT. It is handy for merging text fields such as tags or category names into one clean label.
CONCAT(Field_1, Field_2)CONCAT takes two values. To join more, nest it, for example CONCAT(Field_1, CONCAT(" | ", Field_2)).
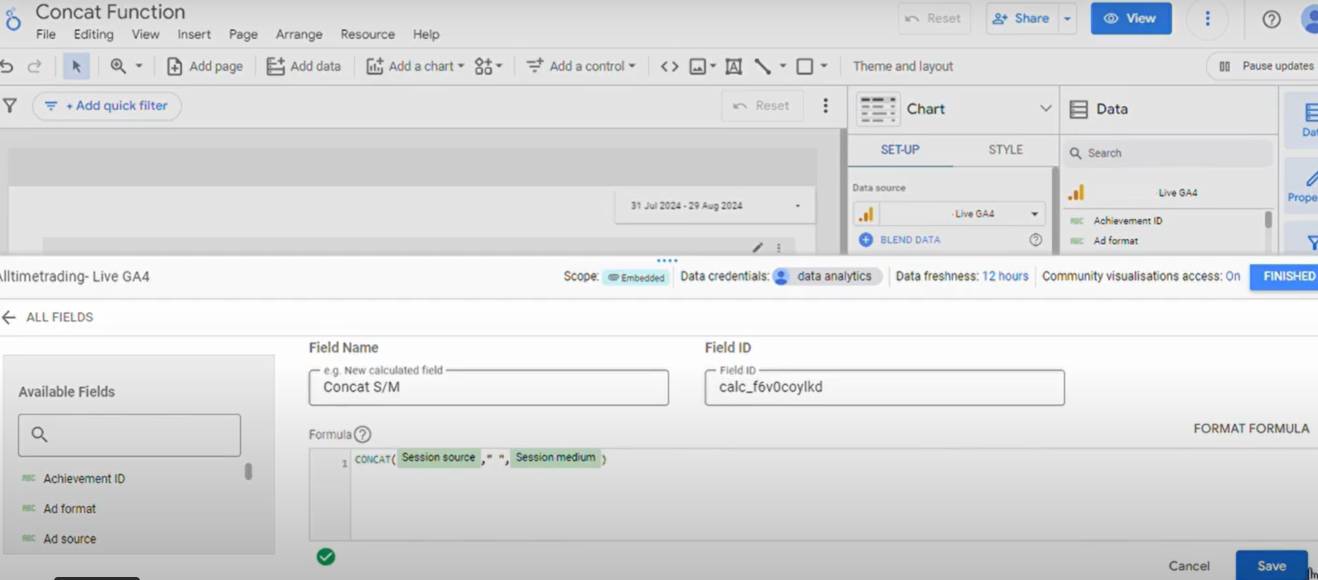
Video: Concatenate values in Looker Studio
7. How do you label dates as “Current Month” or “Last Month” automatically?
Relabelling dates in a report as “Current Month”, “Last Month” or “X months ago” by hand is tedious, especially when reports update often. A calculated field can work out how far each date is from today and label it for you.
- Open your data source: go to the data source and choose “Add a field”.

- Create the calculated field: paste this formula. It counts months as year × 12 + month, so it also works across a new year (December to January).
CASE
  WHEN (EXTRACT(YEAR FROM CURRENT_DATE()) * 12 + EXTRACT(MONTH FROM CURRENT_DATE()))
     - (EXTRACT(YEAR FROM Date) * 12 + EXTRACT(MONTH FROM Date)) = 0 THEN 'Current Month'
  WHEN (EXTRACT(YEAR FROM CURRENT_DATE()) * 12 + EXTRACT(MONTH FROM CURRENT_DATE()))
     - (EXTRACT(YEAR FROM Date) * 12 + EXTRACT(MONTH FROM Date)) = 1 THEN 'Last Month'
  ELSE CONCAT(
    CAST((EXTRACT(YEAR FROM CURRENT_DATE()) * 12 + EXTRACT(MONTH FROM CURRENT_DATE()))
       - (EXTRACT(YEAR FROM Date) * 12 + EXTRACT(MONTH FROM Date)) AS TEXT),
    ' months ago')
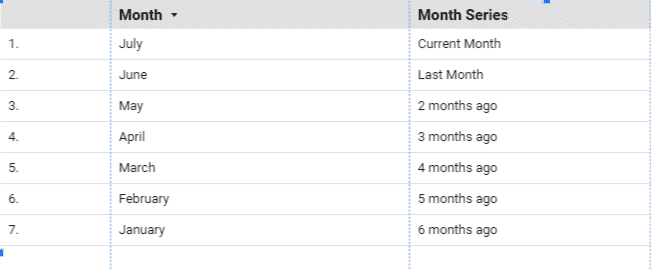
END- Name and save the field: give it a clear name, such as “Month Series”, and save.
How does the date label formula work?
The CASE statement compares the current date with the date in your Date field.
- Month number: each date becomes year × 12 + month, so January 2026 is one month after December 2025. Comparing month numbers alone would break every January.
- Current Month: if the difference is 0, the label is “Current Month”.
- Last Month: if the difference is 1, the label is “Last Month”.
- All other months: CONCAT joins the difference with the text “months ago”.
Example: if it is July and you are looking at May data, the difference is 2 and the report shows “2 months ago”. In January 2026, a date in November 2025 shows “2 months ago” too.
Benefits:
- Automatic updates: the labels move with the current date.
- Less manual work: no relabelling each month.
- Consistency: the same terms across all your reports.
Building reports from a spreadsheet? See how to create a Looker Studio report from Google Sheets.